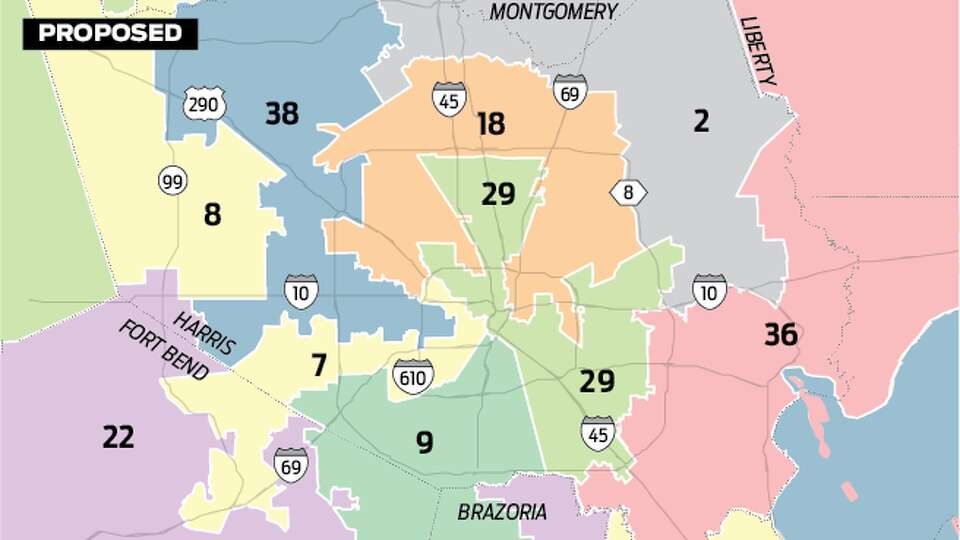
At Texas Rainbow Fund, we believe safe, inclusive public spaces and fair representation go hand in hand. That’s why we’re closely tracking proposed changes to congressional district boundaries across the Houston region, especially where those changes affect historically marginalized communities, including LGBTQ+ Texans and people of color.
Below is a snapshot of what’s changing in three key districts: TX-7, TX-18, and TX-29—and why it matters.
Before looking at the individual districts, it’s important to understand something that maps alone don’t show: not every oddly shaped district is the result of manipulation—and not every “cleaner” map represents progress.
For decades, Texas’ 18th Congressional District had an irregular shape that often drew criticism for looking gerrymandered. But that shape existed for a reason. It was one of the only ways to create a district in which Black voters could meaningfully elect a candidate of their choice.
That reality traces back to Houston’s history of racial segregation and redlining. Discriminatory housing policies confined Black residents to specific parts of the city—communities such as Independence Heights, Fifth Ward, and Third Ward. Because these neighborhoods were geographically separated by design, a contiguous, compact district could not fully capture the historic Black community without connecting those areas together.
In other words, what appeared unusual on a map was often an attempt to counteract earlier racist policies, not reinforce them.
Today, proposed changes make the district appear more continuous and visually conventional. But for many residents and historians, that apparent simplicity comes at a cost. Redrawing boundaries in ways that disperse long-connected communities risks weakening one of Houston’s most historically significant civil-rights districts.
At the same time, changes elsewhere raise parallel concerns: the potential dilution of Black voting power in one district alongside the reduction of Latino representation in another, particularly in TX-29. Together, these shifts suggest a broader pattern in which communities that previously relied on collective political strength may see that influence diminished.
Sometimes, what looks “fair” or orderly to the naked eye can erase the historical context that made representation possible in the first place. District lines are never just geometry—they reflect decades of policy decisions, both harmful and corrective. Understanding that history is essential to understanding what is happening now.
TX-7: Fragmentation Disguised as Balance
Texas 7th Congressional District
What’s changing
- The proposed map slightly increases the White share of the district (from ~37% to ~40%)
- Black and Asian representation declines
- The district becomes slightly more geographically stretched as it stretches into the Heights
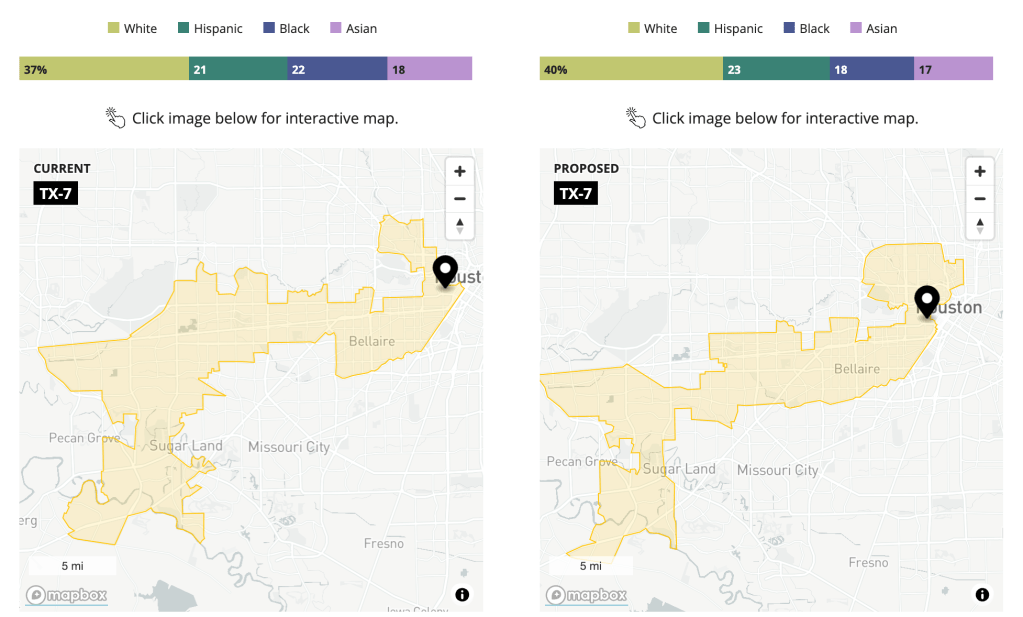
Why it matters
TX-7 has long been a politically competitive, culturally mixed district that includes LGBTQ-friendly neighborhoods and active civic coalitions. Subtle demographic shifts—paired with boundary reshuffling—can dilute the collective voice of communities that rely on coalition politics for representation.
When districts become less compact and less community-based, it becomes harder for LGBTQ+ residents to organize, advocate, and be heard—especially on issues like housing stability, transportation safety, and public health access.
TX-18: A Historic District Weakened
Texas 18th Congressional District
What’s changing
- Black representation increases significantly (from ~39% to over 50%)
- White representation drops sharply
- The district is radically redrawn, breaking long-standing geographic continuity
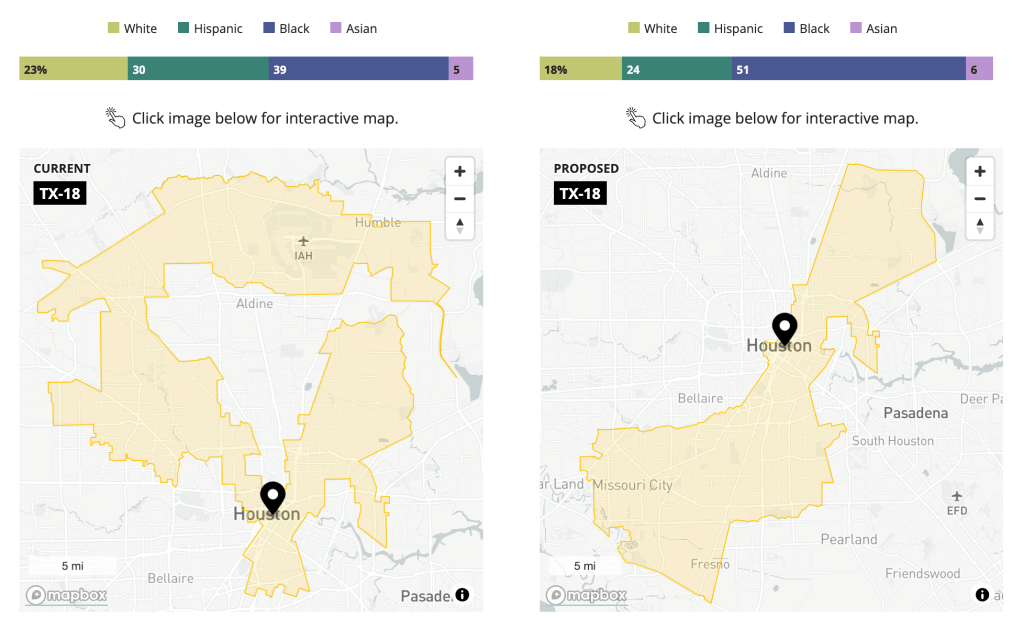
Why it matters
TX-18 is one of Houston’s most historically significant civil-rights districts. While increased Black representation may appear positive on paper, the way the district is reshaped raises serious concerns.
Splitting neighborhoods and stretching boundaries risks weakening shared interests—especially for LGBTQ+ Black Texans, who already sit at the intersection of multiple systemic inequities. Representation isn’t just about percentages; it’s about whether communities remain intact enough to advocate for themselves.
TX-29: Packing Instead of Empowering
Texas 29th Congressional District
What’s changing
- Hispanic representation decreases from ~64% to ~43%
- Black representation nearly doubles
- The district becomes more compact—but more heavily “packed”
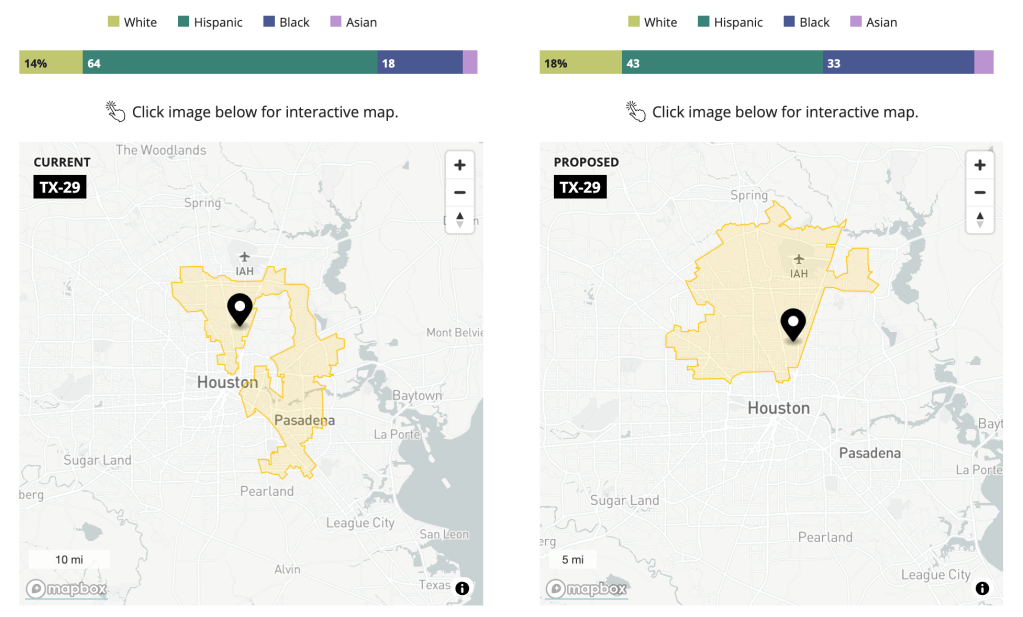
Why it matters
TX-29 has been a Latino opportunity district for decades. The proposed changes appear to concentrate voters rather than empower them—reducing broader regional influence while creating the illusion of representation.
For LGBTQ+ Latinos and Black Texans, this kind of packing can limit political leverage, reduce competitive races, and ultimately diminish responsiveness from elected officials.
The Bigger Picture
Across all three districts, a pattern emerges:
- Communities of color are shifted, packed, or fragmented
- LGBTQ+ populations—who exist across all racial groups—are rendered statistically invisible
- Geographic coherence is sacrificed, making grassroots organizing harder
Redistricting isn’t just a technical exercise. It shapes who feels safe showing up, who gets investment, and whose voices carry weight.
What Texas Rainbow Fund Is Watching For
We are paying close attention to:
- Whether communities remain intact or are split apart
- How changes affect access to safe streets, schools, and public spaces
- Whether proposed maps comply with both the letter and spirit of the Voting Rights Act
Most importantly, we are listening to LGBTQ+ Texans who live in these districts—because lived experience tells a deeper story than percentages alone.
View Your District: Current vs. Proposed
District maps can feel abstract until you see how they affect your own address. To make this more tangible, we’ve included interactive maps that let you explore both the current congressional district boundaries and the proposed changes side by side.
Use the interactive tool below to:
- Enter your home address
- See which congressional district you’re in today
- Compare it with the proposed district boundaries
- Understand how your community may be shifted, split, or combined
This side-by-side view helps show how redistricting isn’t just about lines on a map—it directly shapes representation, community identity, and political voice.


Leave a comment